The Only Tool
Long-Term Investors Need
Alpha Strategy brings institutional-grade tools to your browser so you can research stocks, monitor markets and make confident decisions.
We Make Complex Simple and Simple Fast
Designed to make every step of investing feel intuitive
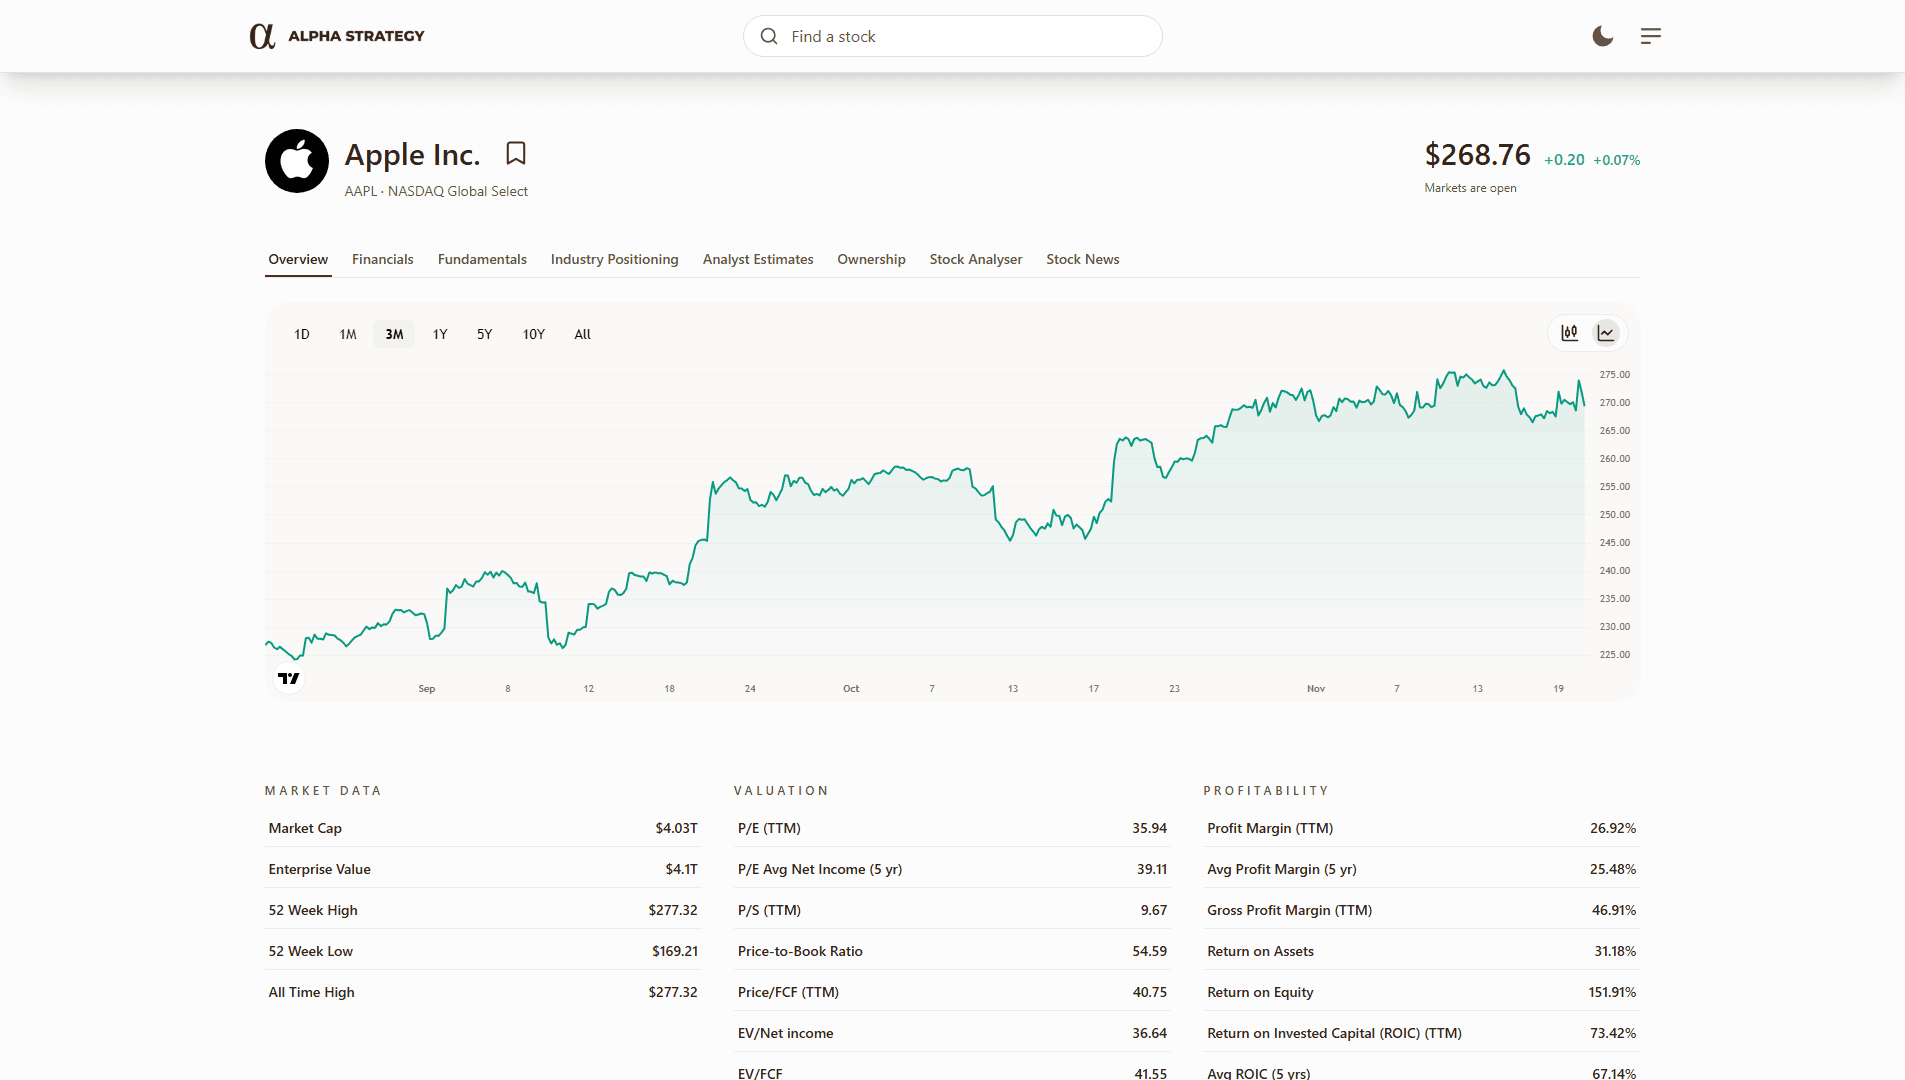
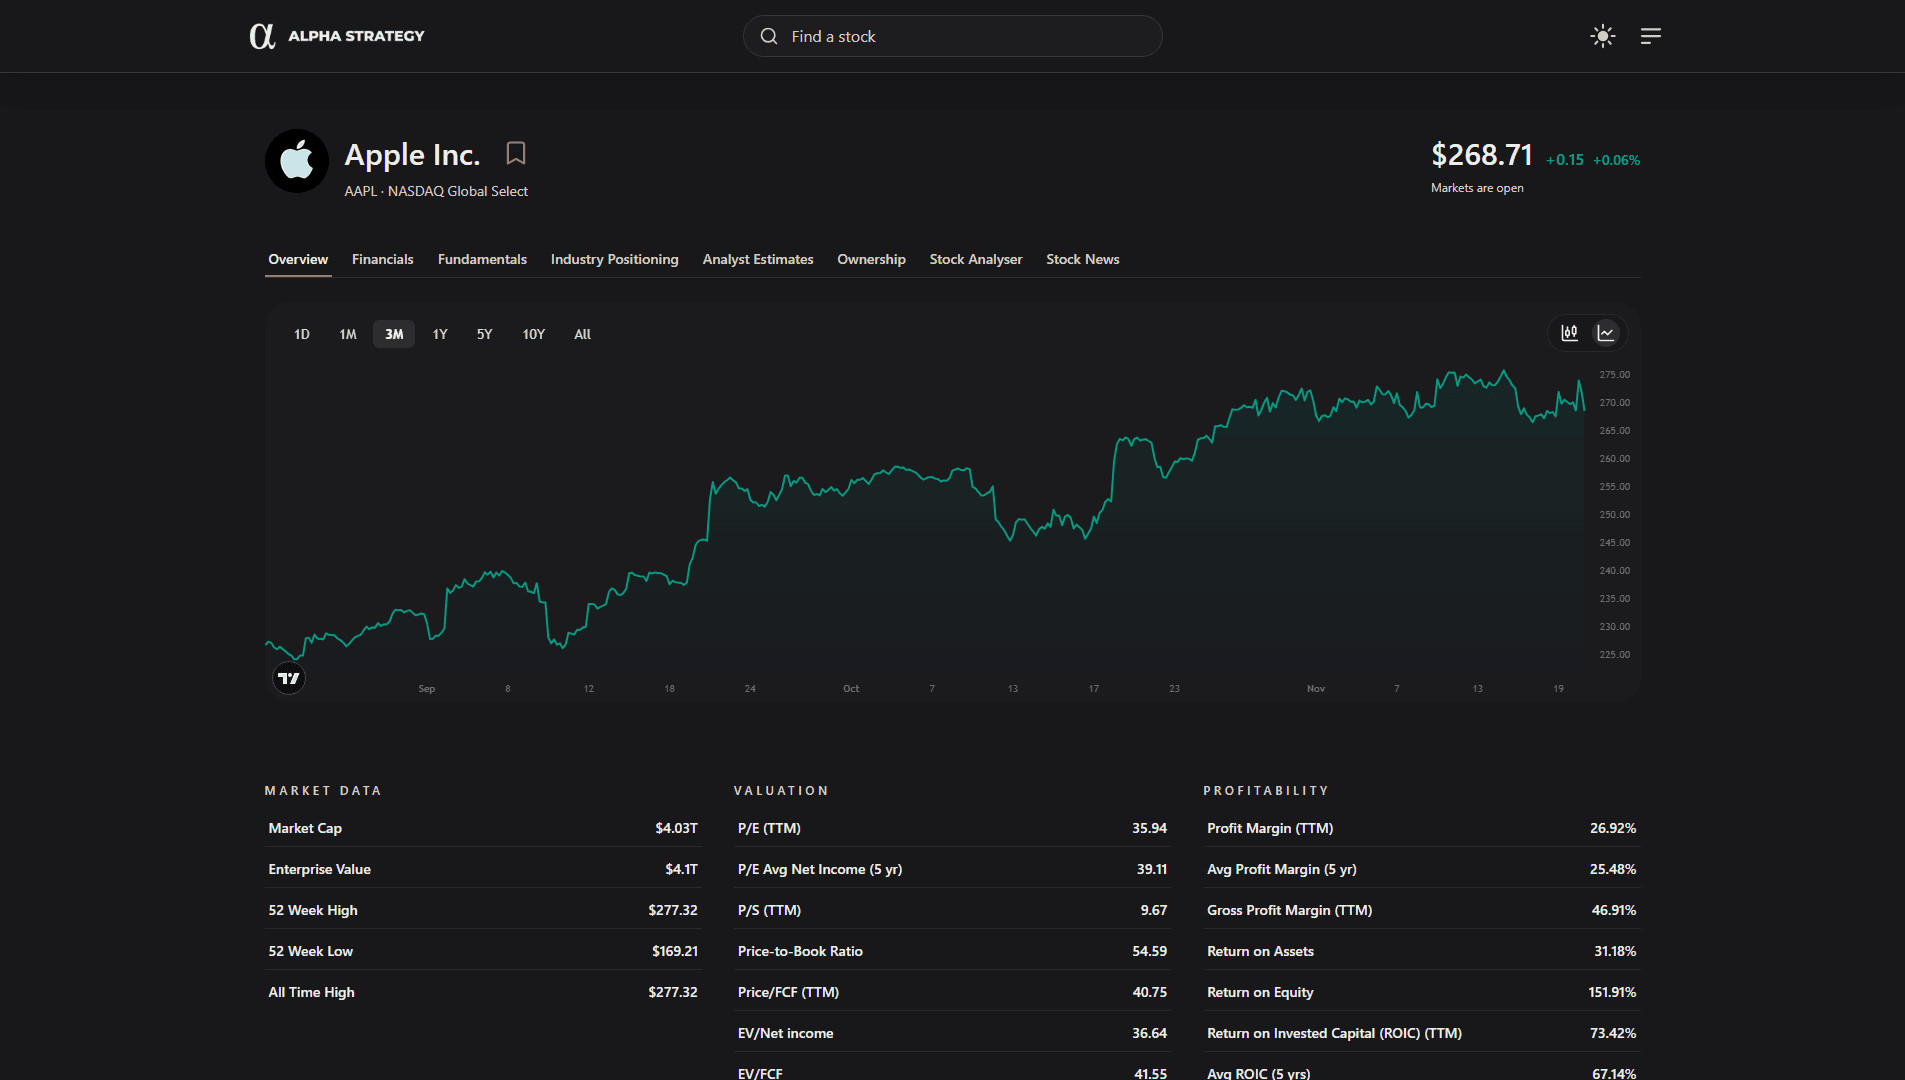


Your Starting Point for Smarter Analysis
Get a clear, instant picture of how a company is performing today and where it may be heading. By combining price trends, essential financial metrics, and the company’s core profile, it helps you quickly understand the stock’s quality, momentum, and fundamentals. It’s the fastest way to judge whether a business deserves a deeper look across its financials, fundamentals, competitive landscape, analyst expectations, or ownership structure.
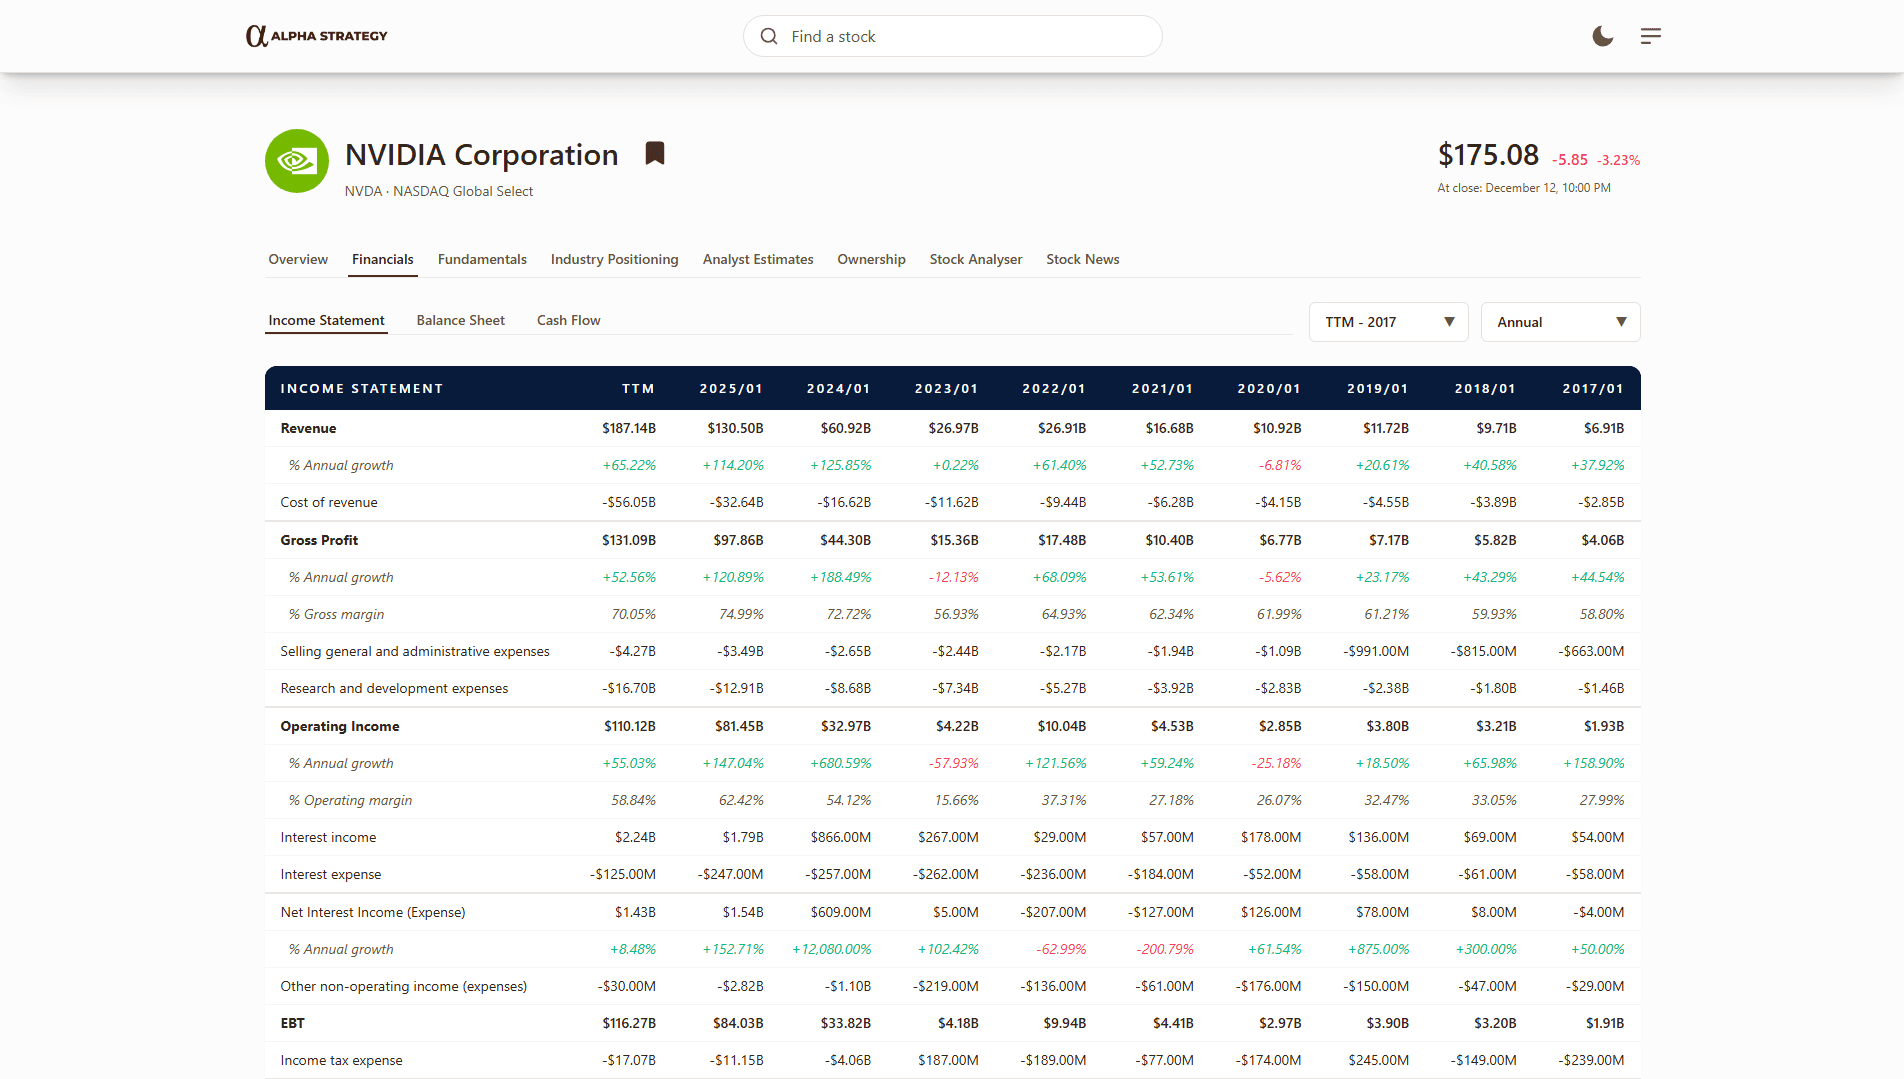
Analyse Financial Performance Over Time
Get a structured, data-driven view of how a company’s financial engine is evolving. With historical income statements, balance sheets, and cash flow data—plus clear growth rates across annual or quarterly periods—you can quickly assess stability, efficiency, and long-term momentum. Financials gives you the hard numbers behind the business so you can validate your thesis, spot trends early, and understand whether performance is improving, weakening, or staying consistent over time.
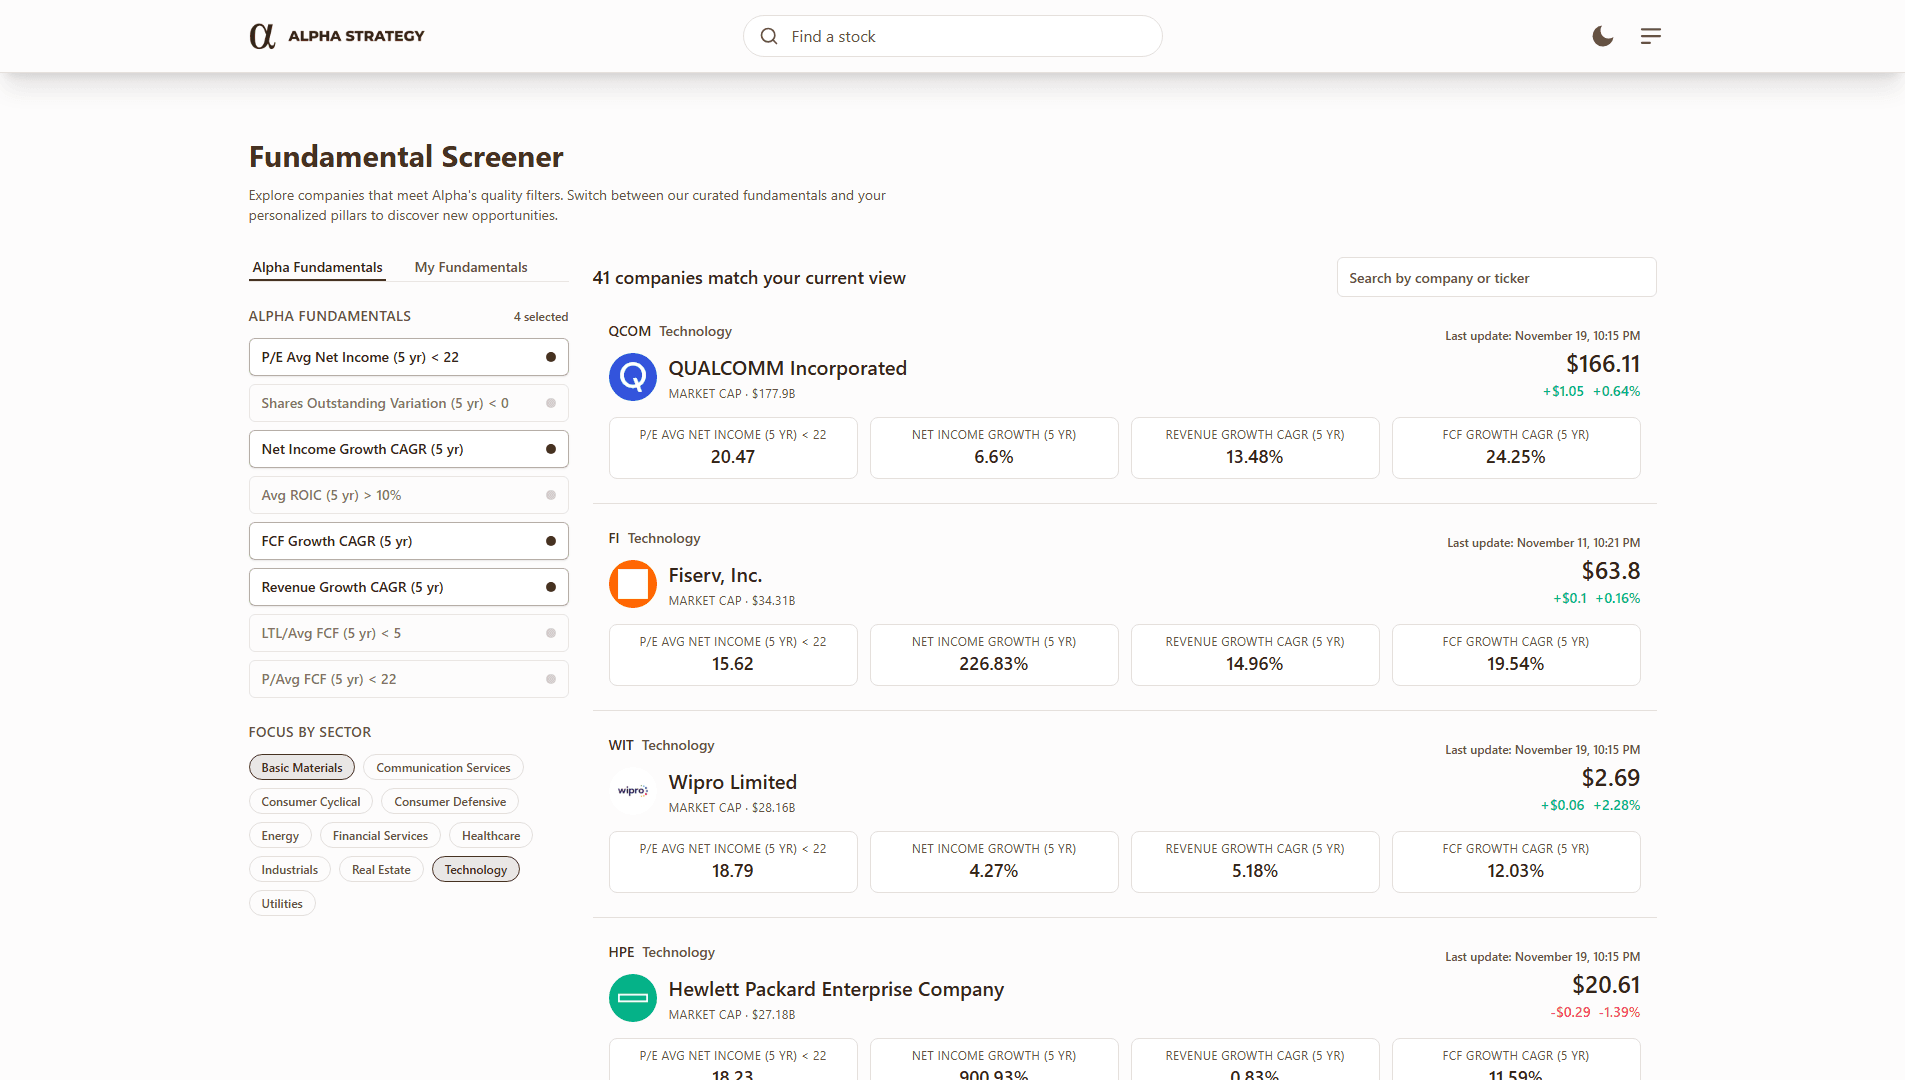
Find the Stocks That Match Your Criteria
Fundamental Screener gives you unprecedented control to explore the entire market through the metrics that matter most to you. Filter thousands of stocks using Alpha Fundamentals or your own custom fundamentals—choosing up to eight at a time and toggling them on or off to instantly see how the universe reshapes. With flexible criteria and sector-level filtering, you can uncover hidden opportunities, compare companies with precision, and build screenings that reflect your investing philosophy, not someone else’s.
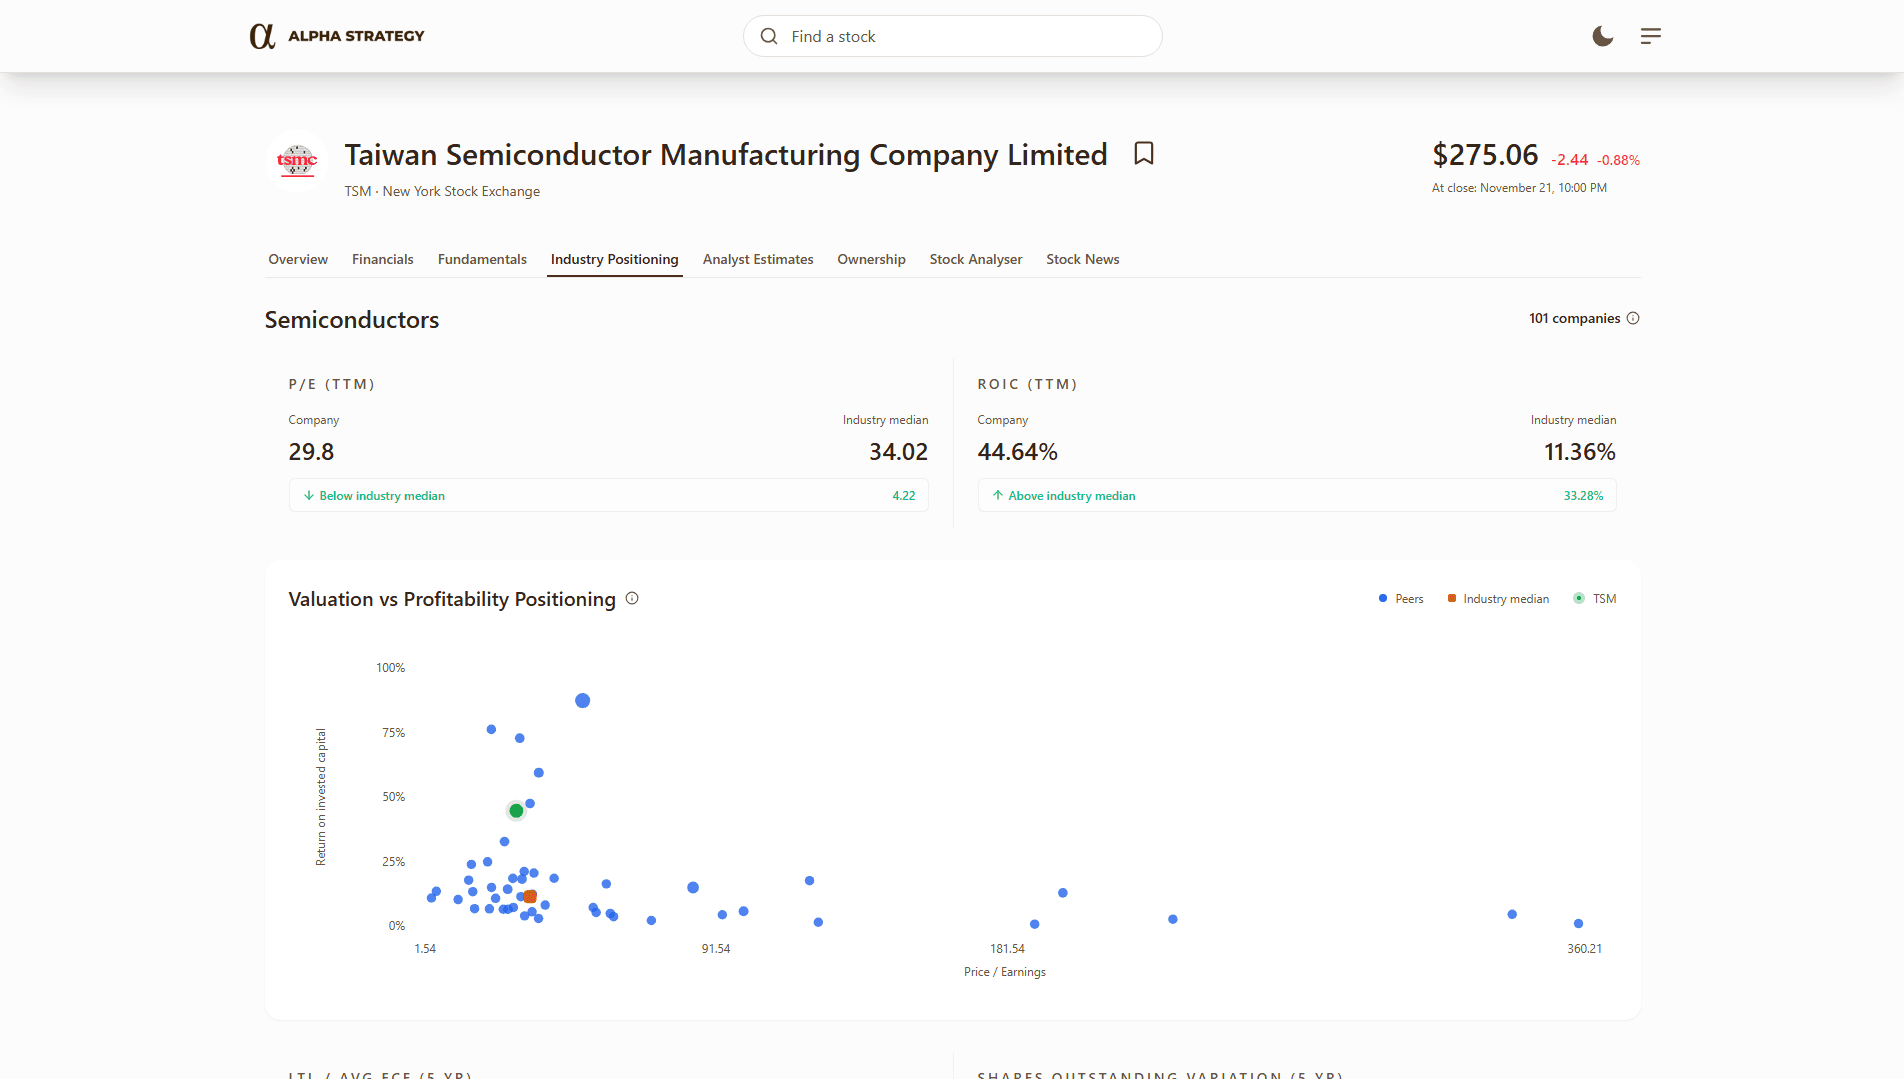
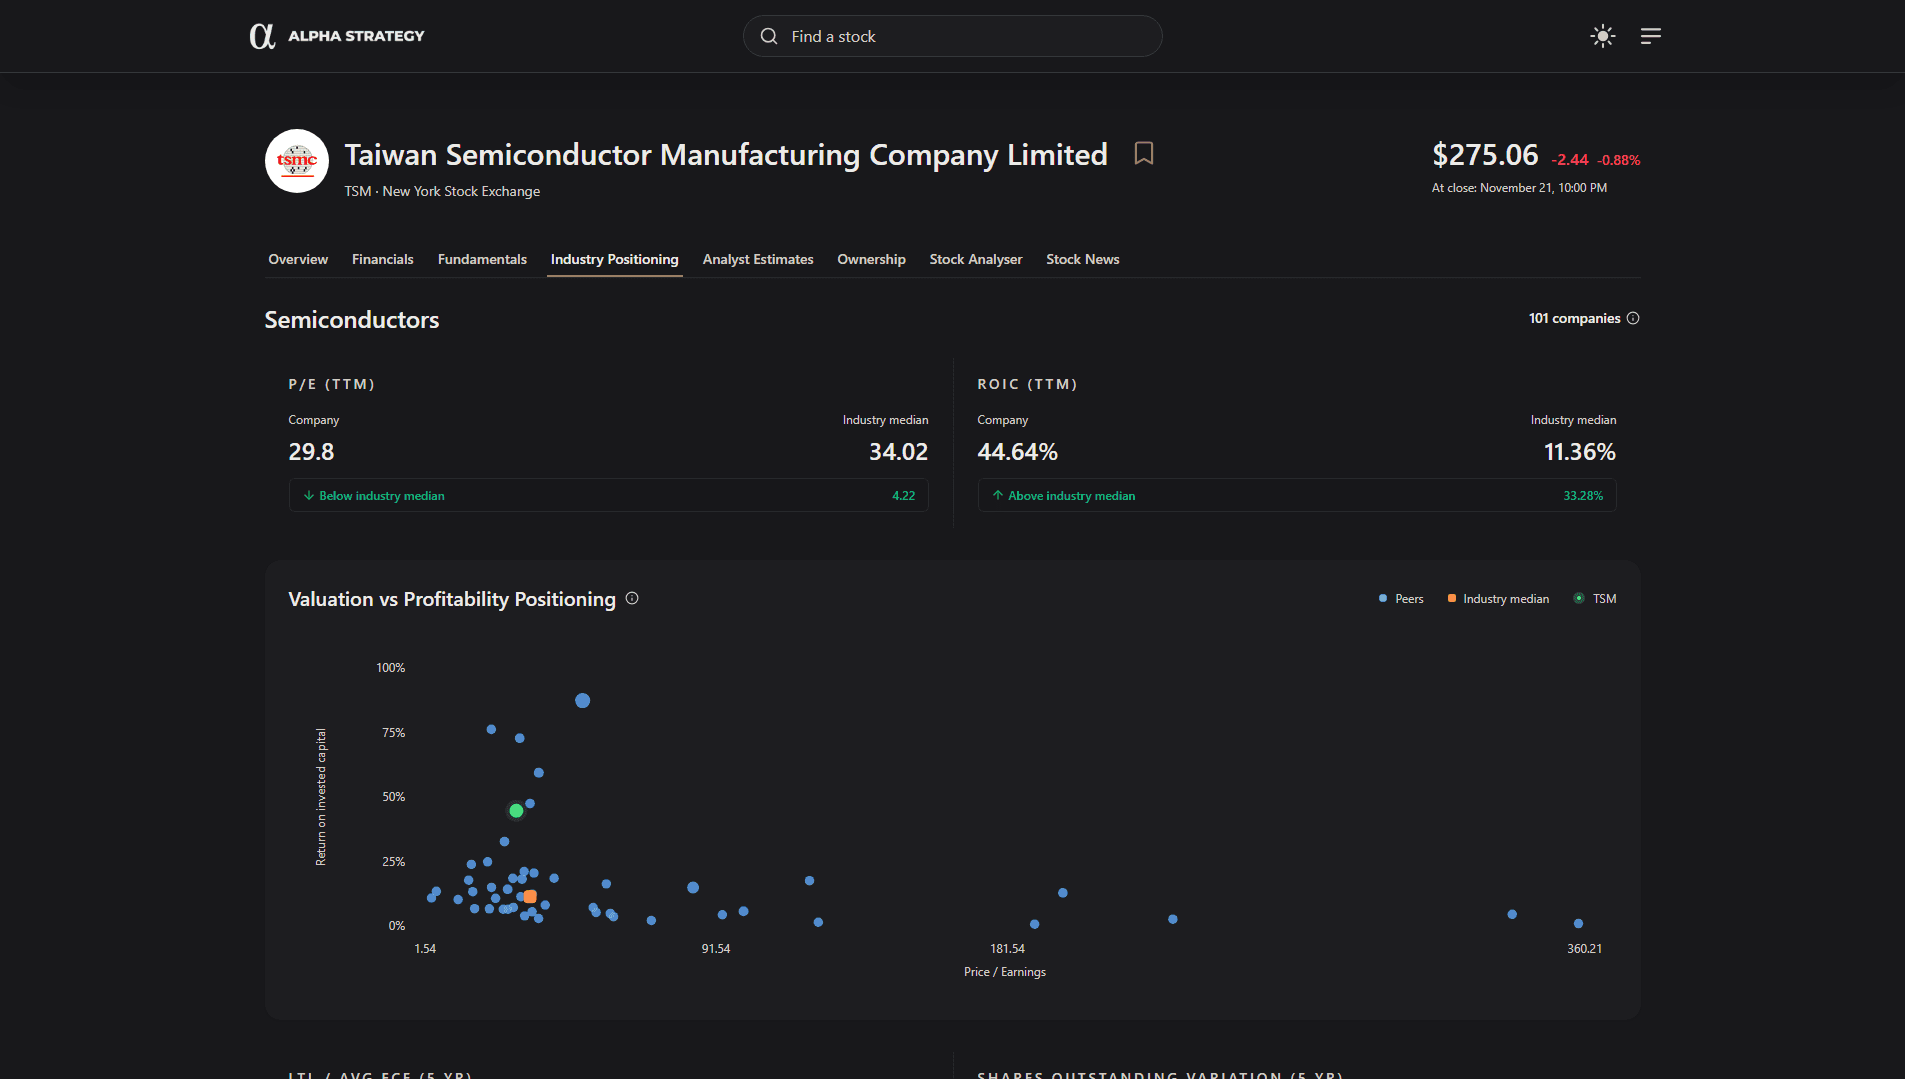
Explore the Competitive Landscape
The Industry Positioning tab helps you understand a company in the context of its competitive landscape—through interactive visual benchmarks and a fully sortable peer table. Each chart reveals how stocks compare across valuation, profitability, leverage, growth quality, and shareholder return, and every data point is clickable, letting you instantly jump into any competitor’s profile. It’s a powerful way to explore industries intuitively, uncover leaders and outliers, and move seamlessly across the market as new insights emerge.
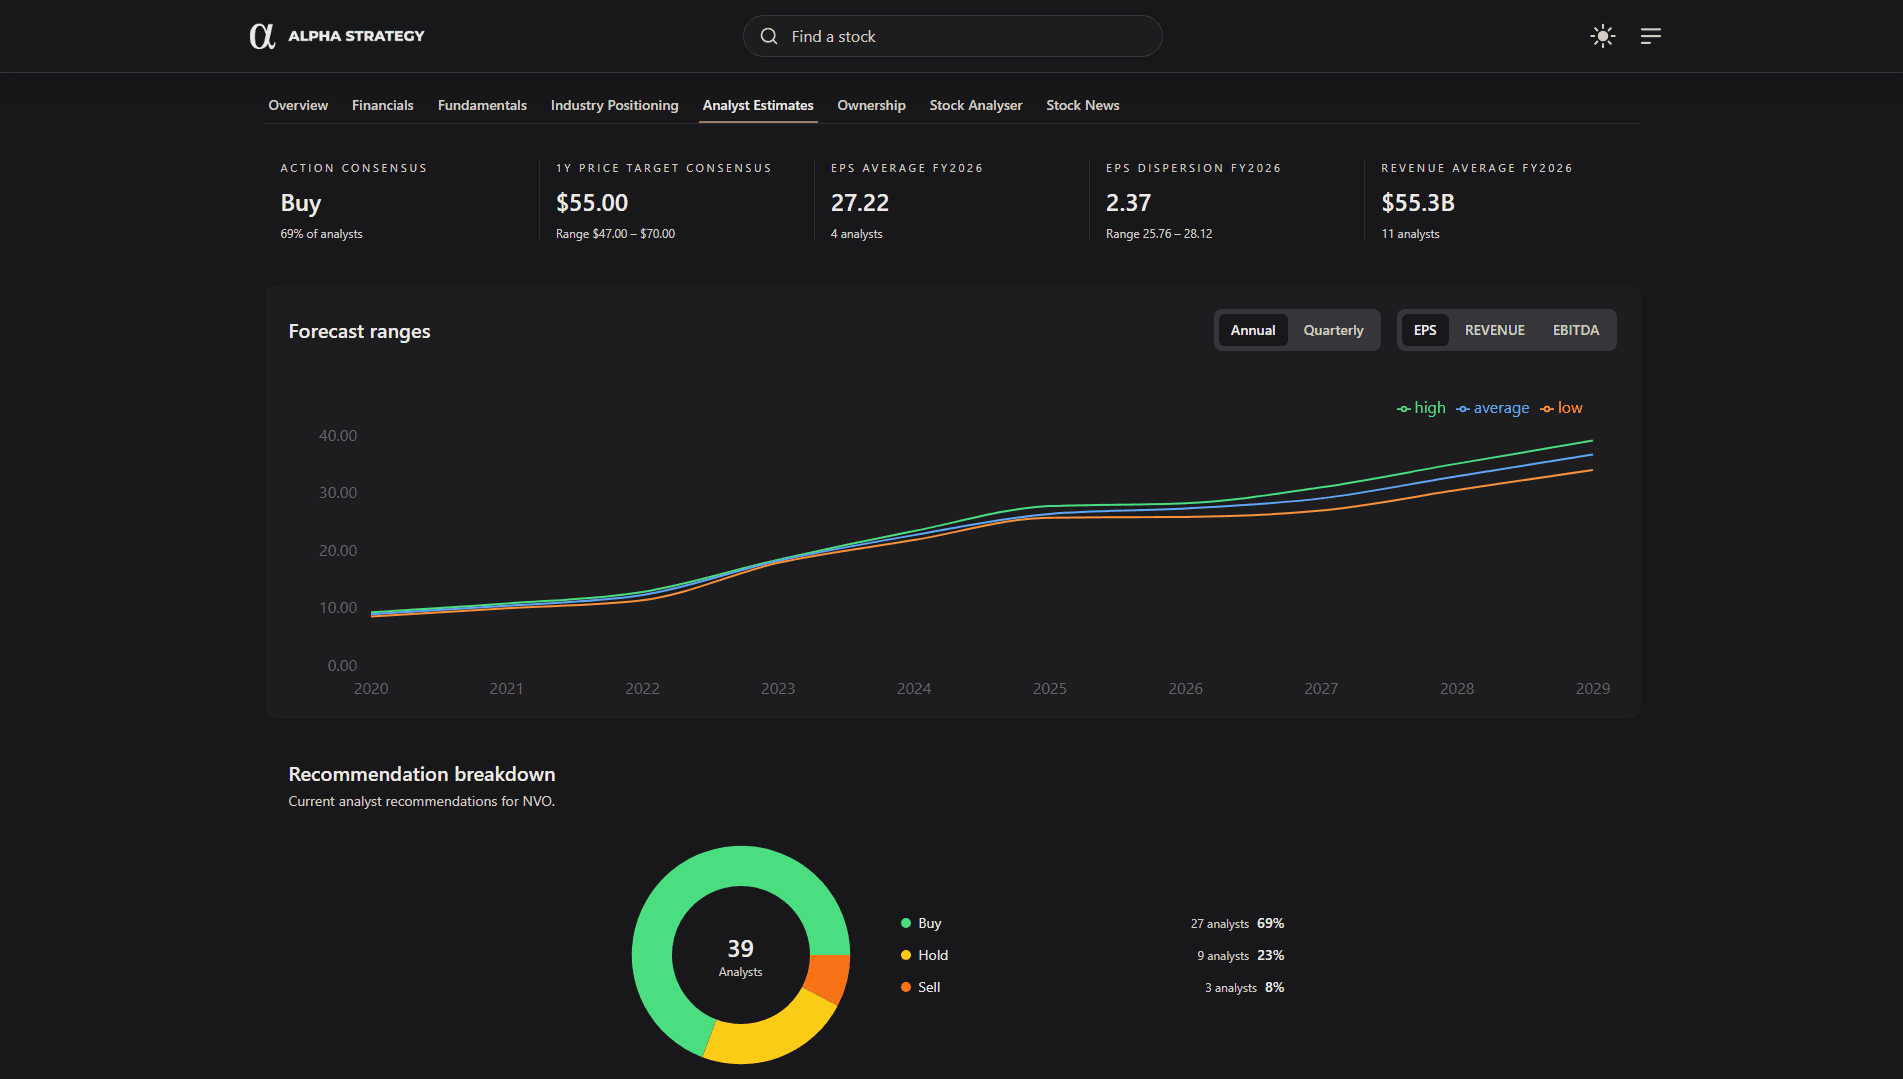
See What the Market Expects
See what analysts expect the company’s future to look like, all in one clear and interactive view. Quick-reference cards summarize consensus targets and key estimate ranges, while the forecast charts let you explore past and projected EPS, revenue, and EBITDA across annual or quarterly horizons. With high, low, and average predictions side by side, you can instantly gauge both direction and uncertainty. A clear breakdown of buy, hold, and sell recommendations completes the picture—helping you understand market sentiment, validate your assumptions, and assess how professionals see the road ahead.
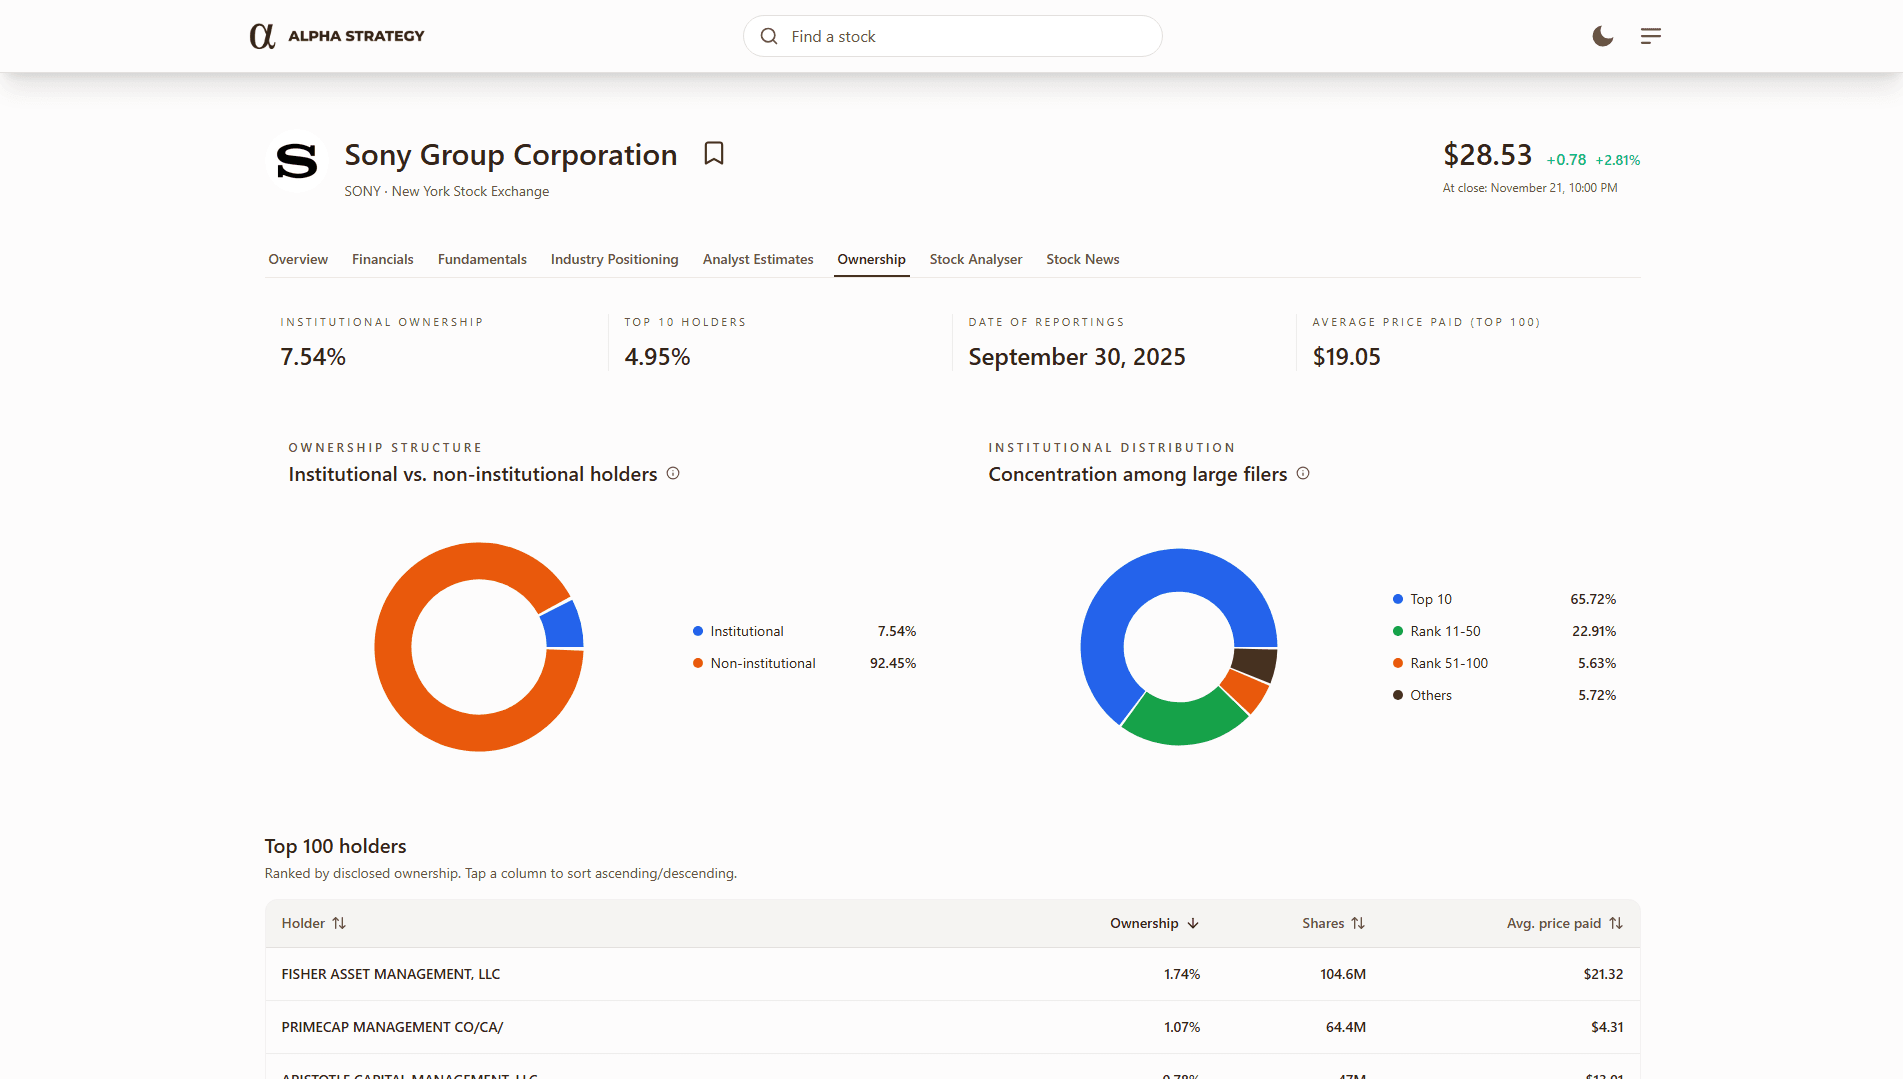
Understand Institutional Influence
The Ownership tab shows you who controls the stock and how institutional conviction is shifting. With a clear breakdown of institutional vs. non-institutional holders and a sortable list of the top 100 investors—including their average price paid—you can quickly gauge confidence, concentration, and potential buying or selling pressure from the biggest players in the market.
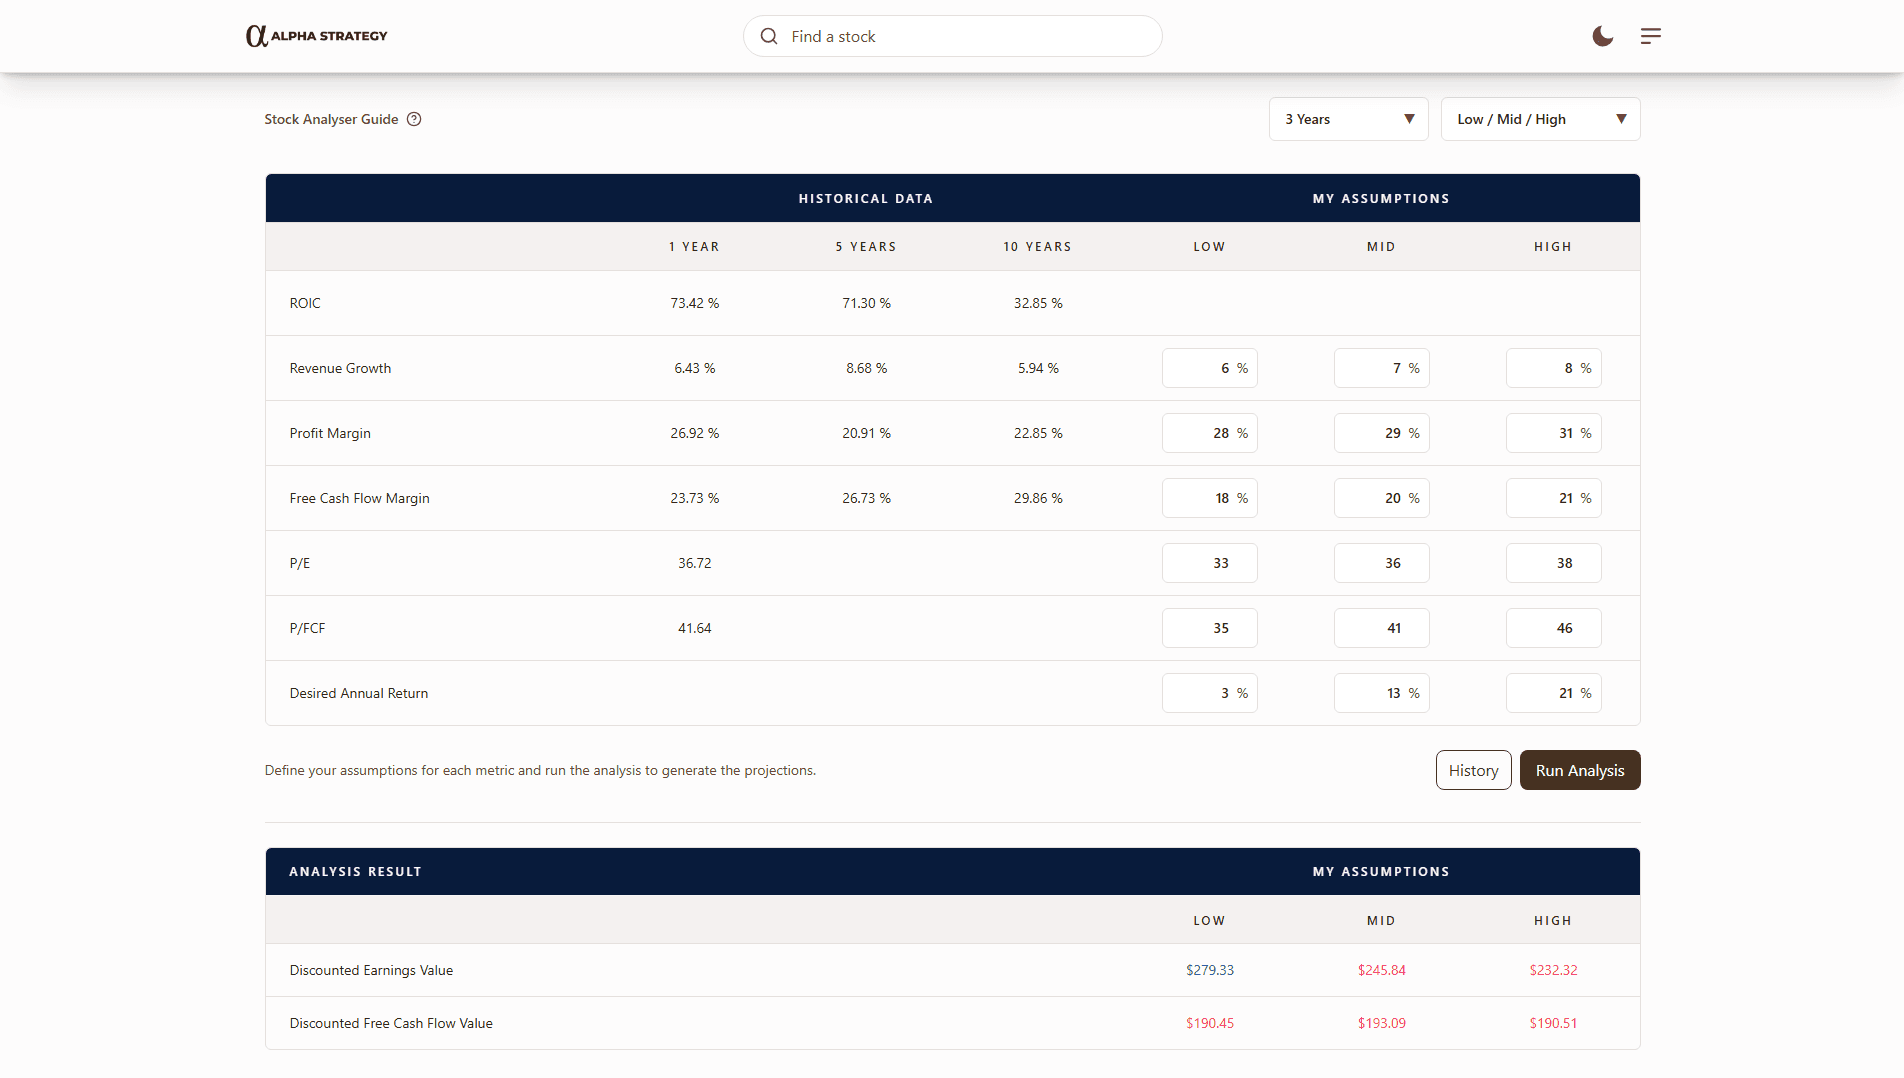
Turn Assumptions Into Valuations
Stock Analyser lets you determine what a company is truly worth based on your own expectations of its future. By combining historical performance with customizable growth, profitability, and valuation assumptions, you can model multiple scenarios and instantly see the price ranges that align with your thesis. It’s a powerful way to turn intuition into numbers, validate your conviction, and understand exactly what price makes sense for your long-term return goals.
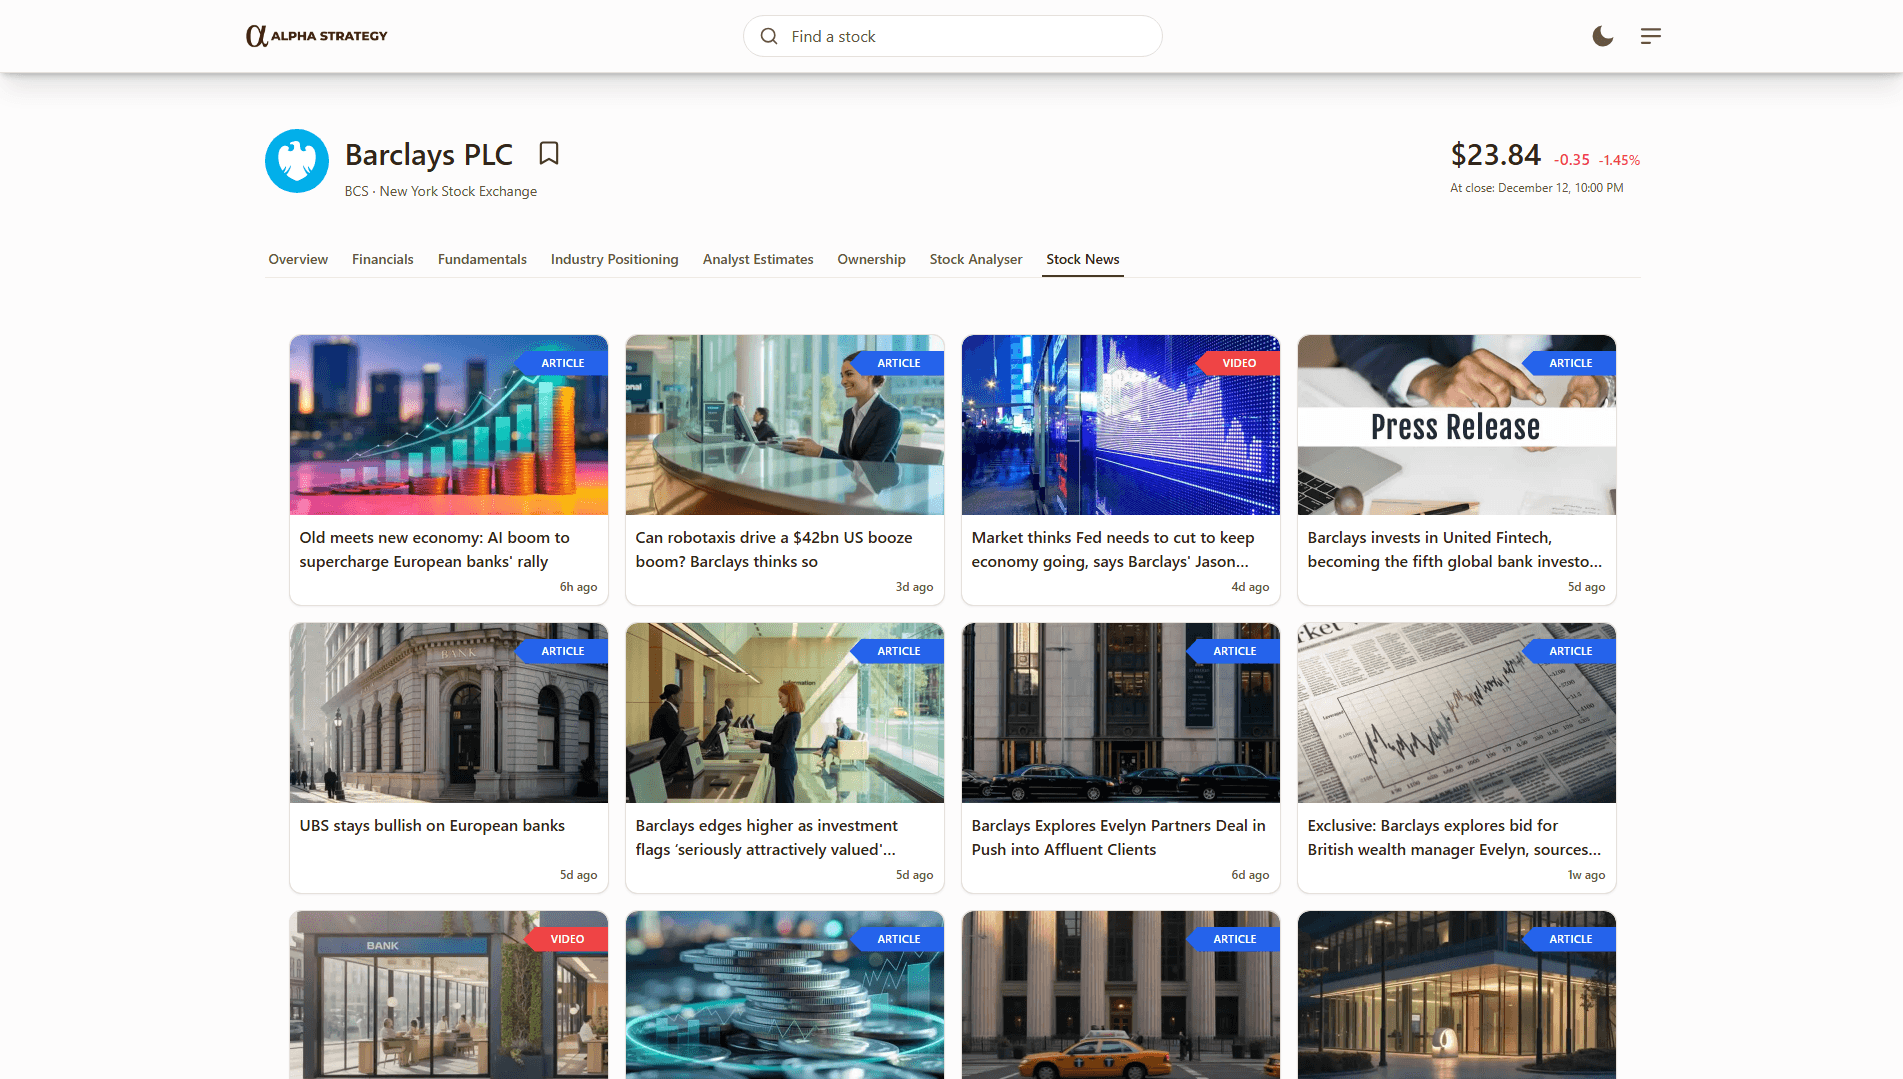
Never Miss a Key Update
Stay instantly updated on the latest developments affecting the company. By gathering recent, relevant headlines in one place, it helps you stay ahead of market-moving events, understand the narrative around the stock, and spot opportunities or risks as they emerge without needing to search across multiple sources.
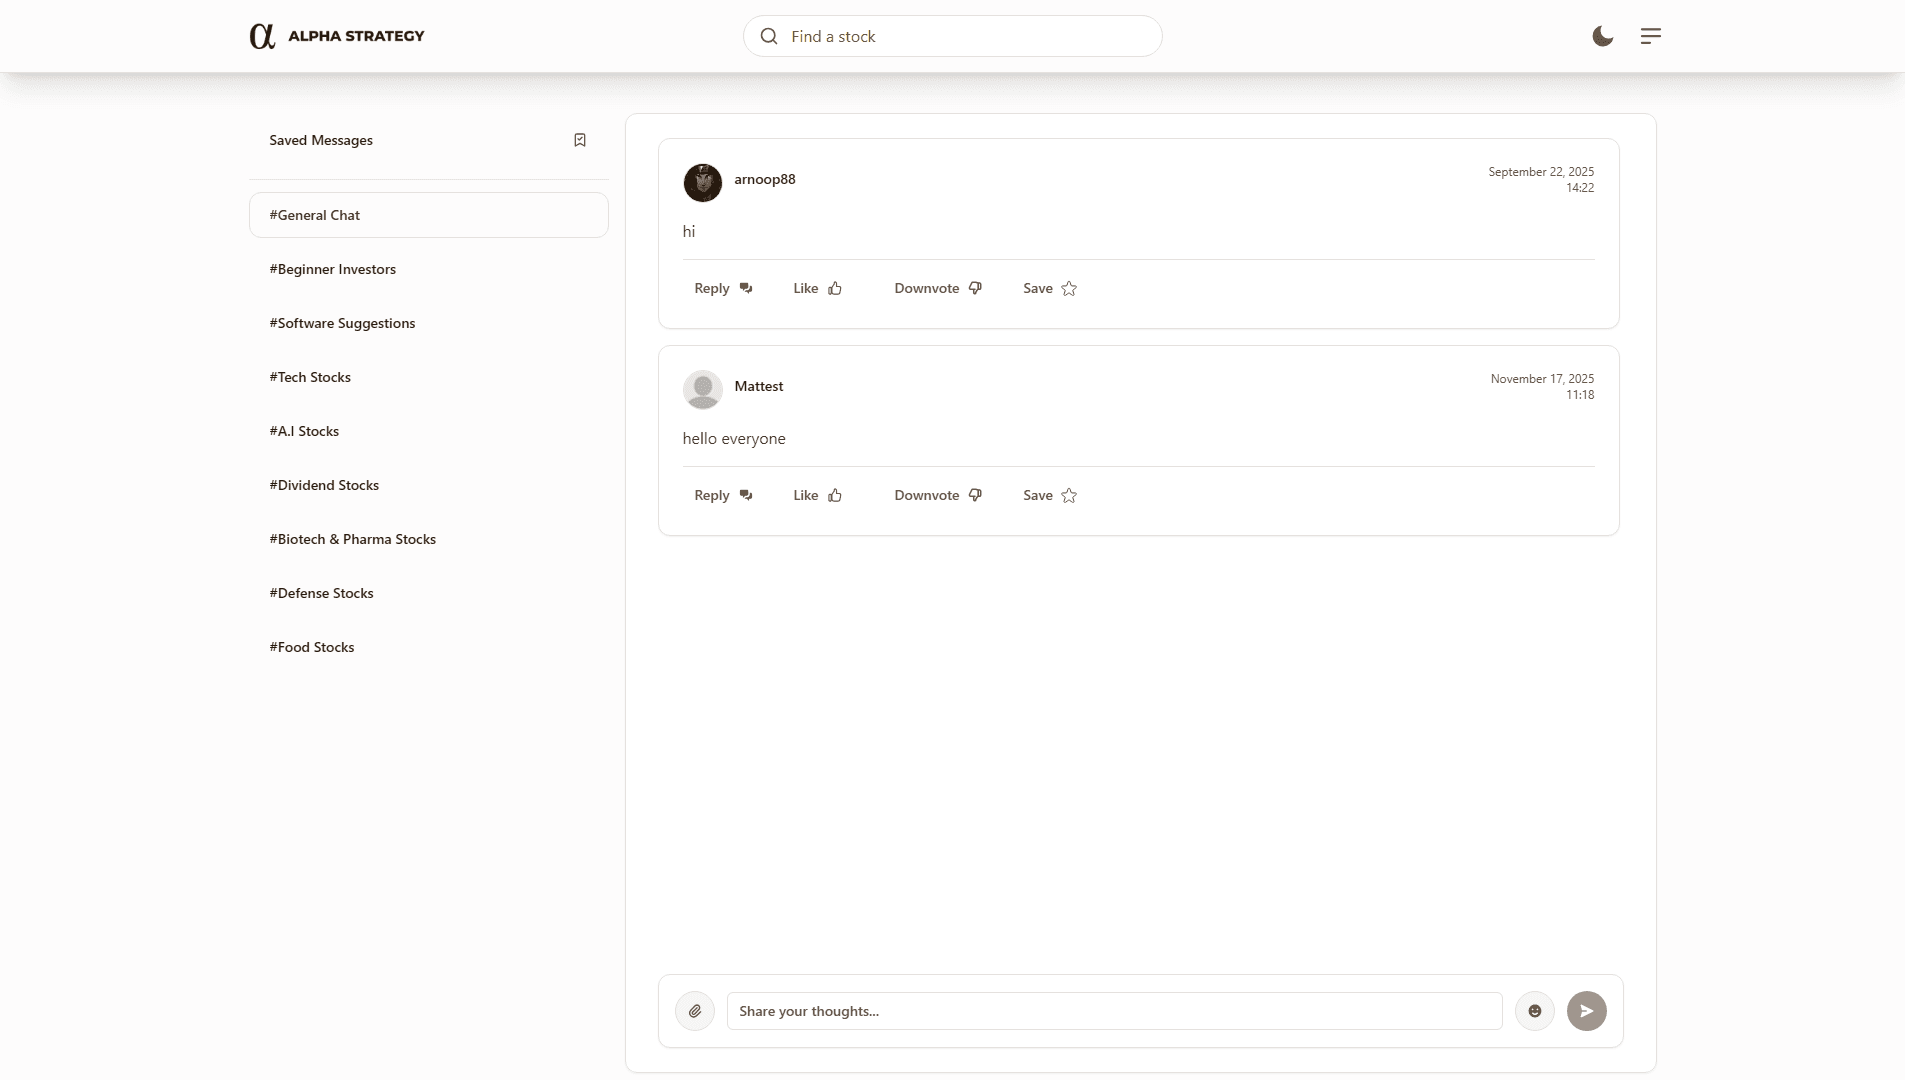
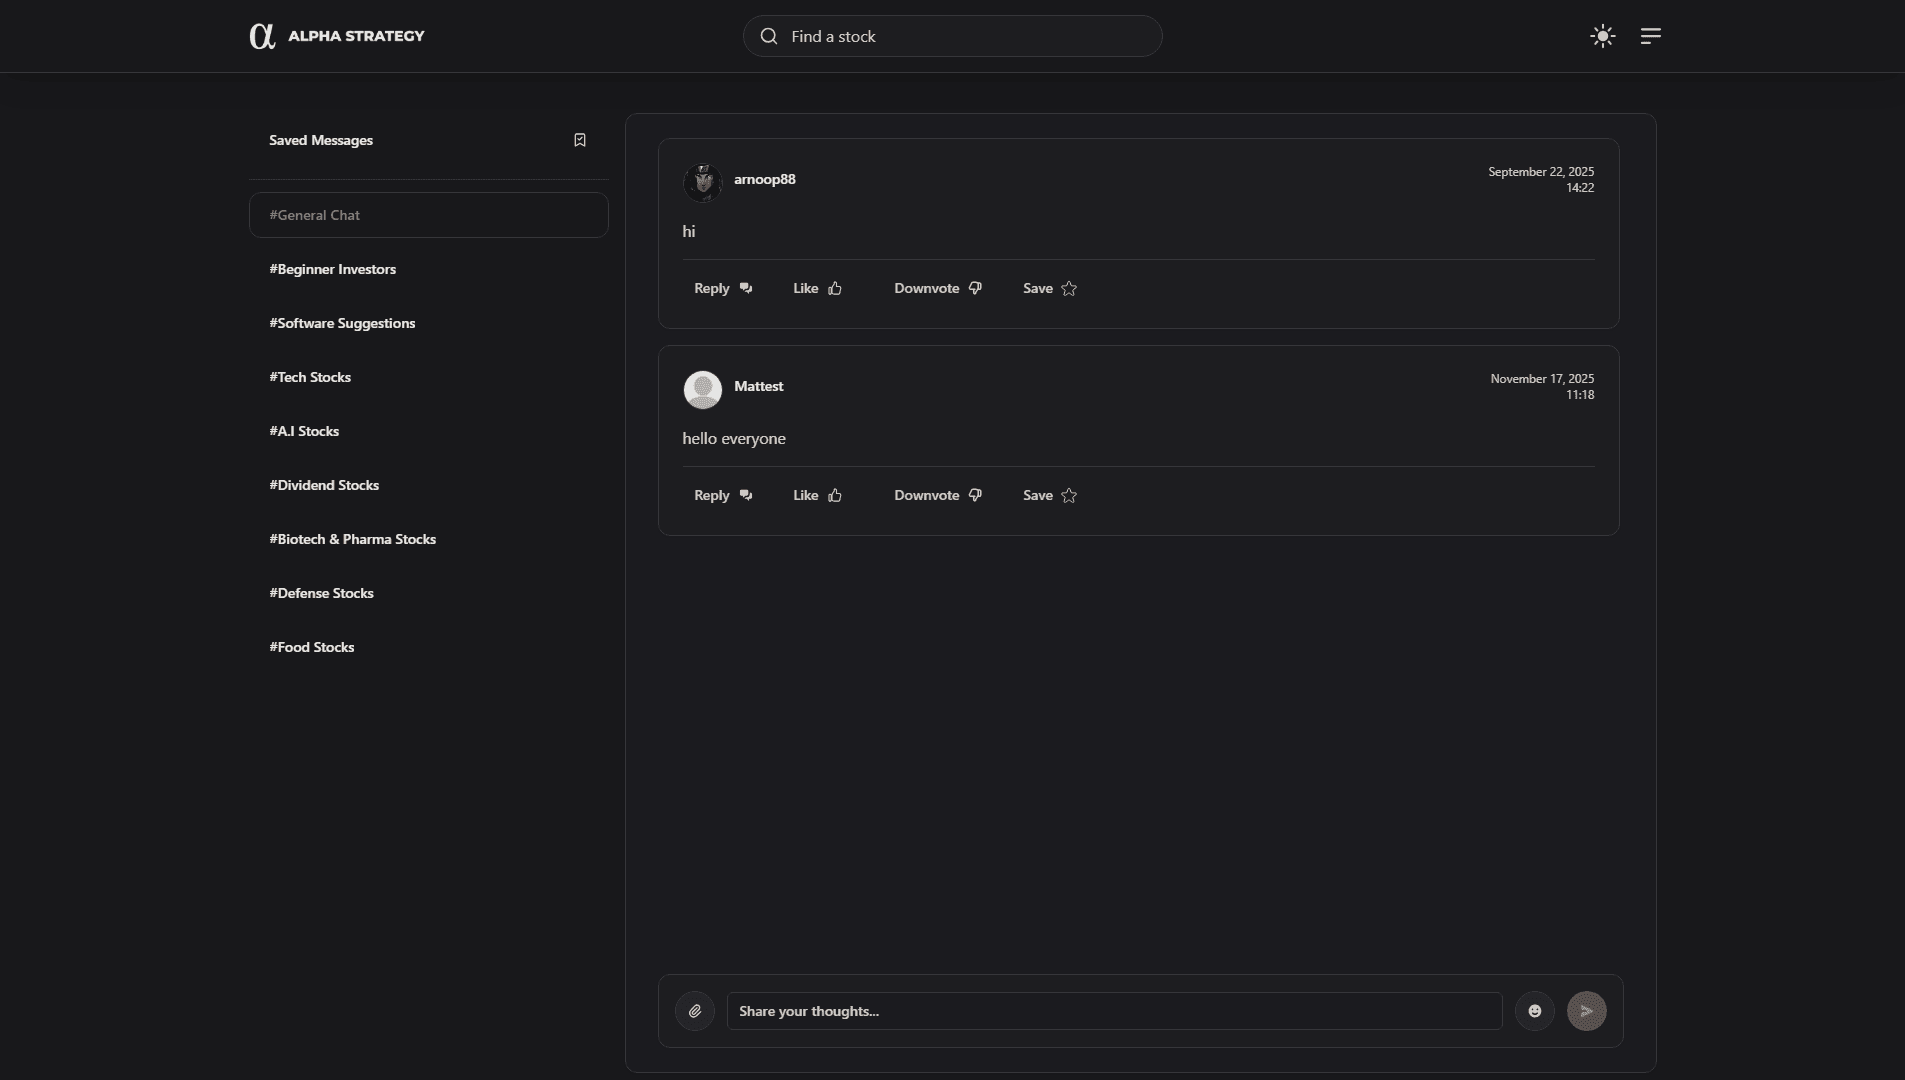
Ask, Discuss, and Explore Together
Join the community and connect with other investors, ask questions, share ideas, and discover new perspectives on the market. Whether you’re comparing stock picks, discussing strategies, or learning from more experienced members, it’s a space to explore the market together and uncover insights you wouldn’t find alone.